
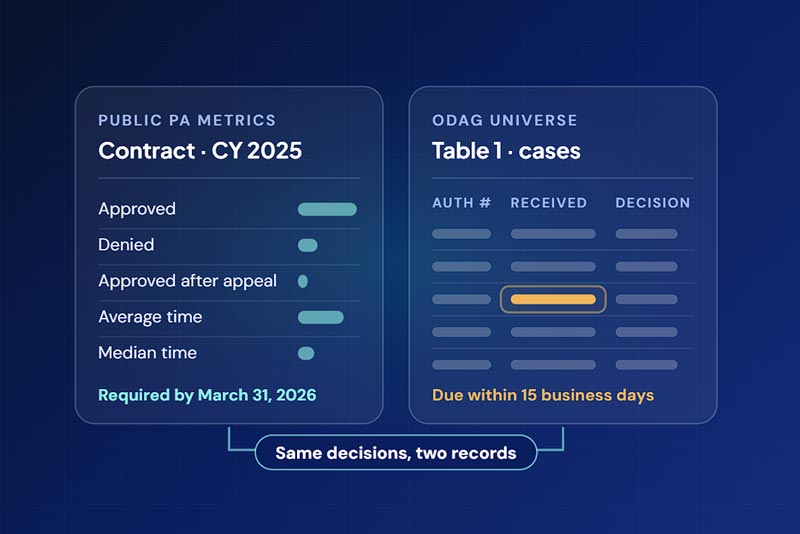
By March 31, 2026, Medicare Advantage organizations were required to post their first public prior authorization metrics: approval and denial rates, approvals after appeal and decision times for calendar year 2025. The reports are now on insurer websites, and KFF has compared those of the largest insurers while noting gaps that limit how the data can be read.
The same decisions also sit in each plan’s case-level records. When CMS audits a plan, those records become its ODAG universe of organization determinations, due within 15 business days of the engagement letter. If the public report and the universe describe different realities, the plan has an exposure that neither reveals on its own.
Two Records
Prior authorization metrics and ODAG universes: same decisions, two records
Prior authorization is a utilization management tool. In Medicare Advantage, a prior authorization decision on a medical item, service or Part B drug is an organization determination under federal rules, which brings notice requirements, appeal rights and deadlines. For medical items and services, that one decision is reported under two separate requirements: in the public prior authorization metrics and, when CMS audits the plan, in the ODAG universe. Part B drug decisions appear only in the universe, because the public reporting rule currently excludes drugs.
| Dimension | Public PA metrics (CMS-0057-F) | ODAG universe, Table 1 |
|---|---|---|
| Level | Contract, aggregated | Individual cases |
| Period | Prior calendar year | Review period CMS requests at audit |
| Scope | PA requests for items and services | Coverage decisions, including those not subject to PA |
| Drugs | Excluded | Part B drugs included |
| Timeliness view | Average and median time (required) | Each case’s dates and times, tested at audit against its deadline |
When different teams or systems produce the public report and the universe, nothing forces them to agree.
Alignment
Where they should align, and where they differ by design
The two records are not built to match. For medical items and services, a plan should still be able to show they tell a consistent story on three points: the share of PA requests approved and denied, decision time measured from receipt and the inclusion of decisions made by delegated entities.
In responses to public comments on its proposed 2027 audit protocols, CMS said it added a field to Table 1 showing whether prior authorization was required for each request. If the final protocol keeps that field, a plan’s prior authorization cases could sit beside its public metrics, though the match would still be approximate. The universe covers a shorter period, and approvals are counted differently. Take a hypothetical plan that approves 880 of 1,000 standard requests at first and 60 more on appeal. Even if both data sets covered the same requests, its public approval rate would be 94%, because CMS directs plans to count approvals after appeal, while its Table 1 cases flagged as requiring prior authorization would show 88%. Both numbers would be correct.
- 880 approved at first
- 60 more approved on appeal
- 60 remaining
Differences built into the definitions should be documented:
-
Scope. Under the proposed 2027 ODAG protocol, Table 1 would also cover concurrent review decisions, reductions of approved treatment and post-acute coverage terminations.
-
Appeals. CMS directs plans to aggregate all appeal levels, internal and external, into the public metric. ODAG Table 2 holds the plan’s own reconsiderations.
-
Counting. CMS asks plans to report universes by authorization number. When one authorization covers several services and any are denied, the request is reported as denied.
The standard is not identical numbers. It is that every difference has a documented reason.
Visibility
Why the gap is becoming visible
Public metrics can hint at what an audit would find. KFF’s review of the six largest Medicare Advantage insurers, covering 69% of enrollment, found a median of about one day for standard decisions in 2025. A median alone says nothing about cases that ran long, but plans must also report the average, and an average well above the median points to a tail of slow decisions. When operations and compliance work from different data, the public report can carry signals the compliance team has not seen. And a tail that met 2025’s 14-day standard deadline may miss the seven-day deadline that has applied to prior authorization decisions since January 2026.
Public numbers invite scrutiny of decision quality. Across the same insurers, KFF found that 12% of standard requests were denied on average and 67% of appealed standard denials were overturned. Each overturn means a request was reviewed twice and the service was covered anyway, and the overturn rate is now public. OIG treats high overturn rates as a sign that some initial denials were wrong, and in a June 2026 report it tied some high denial rates to contractors. Denial and overturn rates are now public signals that oversight can act on.
CMS is moving toward service-level data. Today, CMS sees most plans’ case-level data only during an audit. In a December 2025 memo, CMS said it anticipates expanding its Service Level Data collection to all Medicare Advantage plans in 2027, after a voluntary pilot. CMS also said it plans to stop collecting ODAG Tables 1 through 3 once that data is available for audits, which it does not expect before 2028.
- CMS memo on Service Level Data
- Seven-day prior authorization deadline
- First public prior authorization metrics required
- OIG report on denial rates
- Service Level Data for all MA plans
- CMS plans to stop collecting ODAG Tables 1–3
Break Points
Three places reconciliation can break
The clock. CMS’s reporting template says decision time should be measured from when the payer receives the request. The universe records the date and time of receipt too. If a plan measures from case creation in its UM system instead of first receipt by fax, phone, portal or delegate, its public times look faster than they were. In an audit, receipt times that don’t match source documents can force a universe resubmission, and cases that looked timely can turn out late.
Delegated entities. The Medicare Advantage organization is responsible for every decision its delegates make, and CMS expects universes to include them. If delegate data reaches one record but not the other, or arrives with different timestamps, the records diverge.
Counting rules. If the two records count requests differently, the percentages drift for reasons no one wrote down.
Self-Check
Five audit-readiness questions to answer before CMS asks
- 01Do our public metrics and our ODAG universe draw on the same source data? If not, who reconciles them?
- 02Does the decision clock start at first receipt for every intake channel and every delegate?
- 03Do delegate decisions appear in both our public metrics and our universe, with matching fields and timestamps?
- 04When the two differ, is the reason already recorded, or would someone have to reconstruct it?
- 05Can we produce counts, not just percentages, that tie back to case-level records?
The stronger answer is to build the rules into the work itself. When compliance logic and guardrails sit inside daily operations, working within them meets the requirement by default. Deviations are flagged and documented as they happen, so when a difference appears or a regulator asks why, the explanation already exists. Reports and universes come from the same data on demand. Operations and compliance stay aligned without extra effort, and monitoring surfaces problems in internal teams or delegates early enough to fix them before an audit does.
One Story
One defensible story
A gap between operations and compliance is hard to close with tools built for neither. General-purpose platforms can be configured for a health plan, but the regulatory logic is added on top and has to keep pace with CMS, state regulators, the plan’s own policies and its delegate contracts. Inovaare took the opposite path. Its platform is purpose-built for U.S. health plans: it embeds CMS rules in the workflows operations and compliance teams already run, tracks federal and state regulatory change and links it to the plan’s policies, and monitors delegates from pre-delegation assessment through annual audits. CMS audit universes are generated from the same data, so there is no second copy to drift.